Linear Regression
Linear Regression ,intuitively is a regression algorith with alinear approach. We try to predict a continuous value of a given data point by generealising on the data that we have in hand . The linear part indicate that we are using linear approach in generalising over the data
There are two types of multiple linear Regression: ordinary least squares and generalized least squares (GLS) . THe mian difference between the two is that OLS assumes there is not a strong correlation between any two independent variables GLS deals with correlated independent variables by transforming the data and then using OLS to build the model with transformed data
What are the basic assumption.?
There are four assumption associated with a linear regression model.
1->Linearity:-The relationship between X and the mean of Y is Linear.
2->Homoscedasticity:-The variance of residual is the same for any value of X
3->Independence:-Observations are Independent of each other
4->Normality:-For any fixed value of X , Y is normaly distributed (if not normaly distributed then applu log transformation,box transformation,etc.)
Assumption :https://www.analyticsvidhya.com/blog/2016/07/deeper-regression-analysis-assumptions-plots-solutions/
EX.
Suppose we want to predict the price of a house by knowing its size . You have some data which has some house prices ad corresponding sizes .Charting the data and fitting a line among them will look something like this 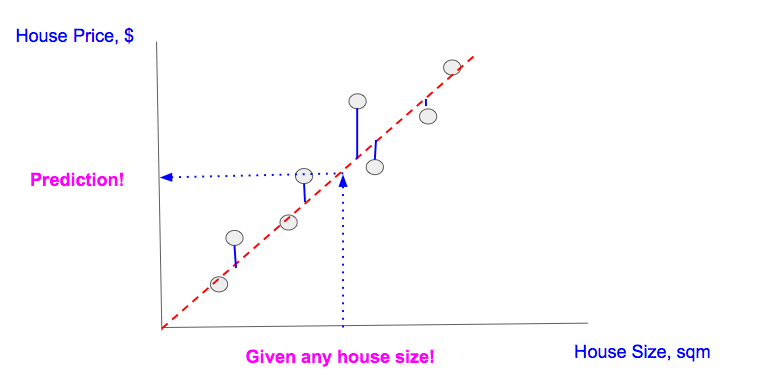
To generalise ,you draw a straight line such that it crosses through the maximum points.Once we got that line for house of any size you just project that data point over the line which gives you the house price
The Problem waas never finding the house price the problem was to find the best fit line which generalize over the darta well.
y=mx+c
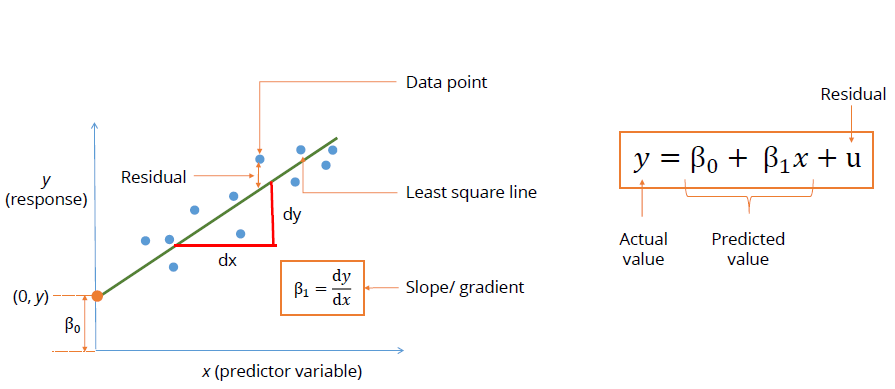
y-> prediction
B(not)-> y intersect of line
b1->slope or gradient means how steep is the line
x->value of data point
u->residual or noise caused by unexplained factors
The Curse of Dimensionality :
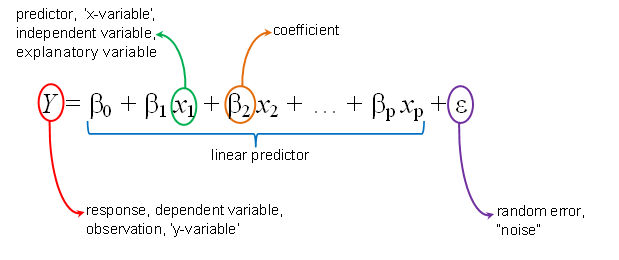
Multiple regrression has n feature so we have to find the best fit line
The Cost function :
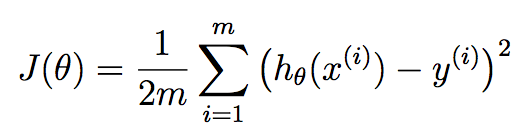
Cost Function is a mathematical construct which is calculated by adding up the squared error terms .
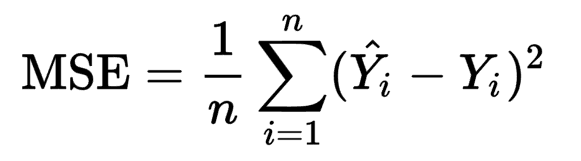
By tweaking the above equation we get the below equation
Our Goal is to reduce cost function ,which in turn improves the accuracy. We can take the parameter values by hit and trial method and calculate MSE for each combination of parameters,but that is not an efficient technique .Seems like there is a calculus solution to this problem .
Gradient Descent is the minimization techique for finding minimum of any function,in this case we want to find the minima of our MSE function.
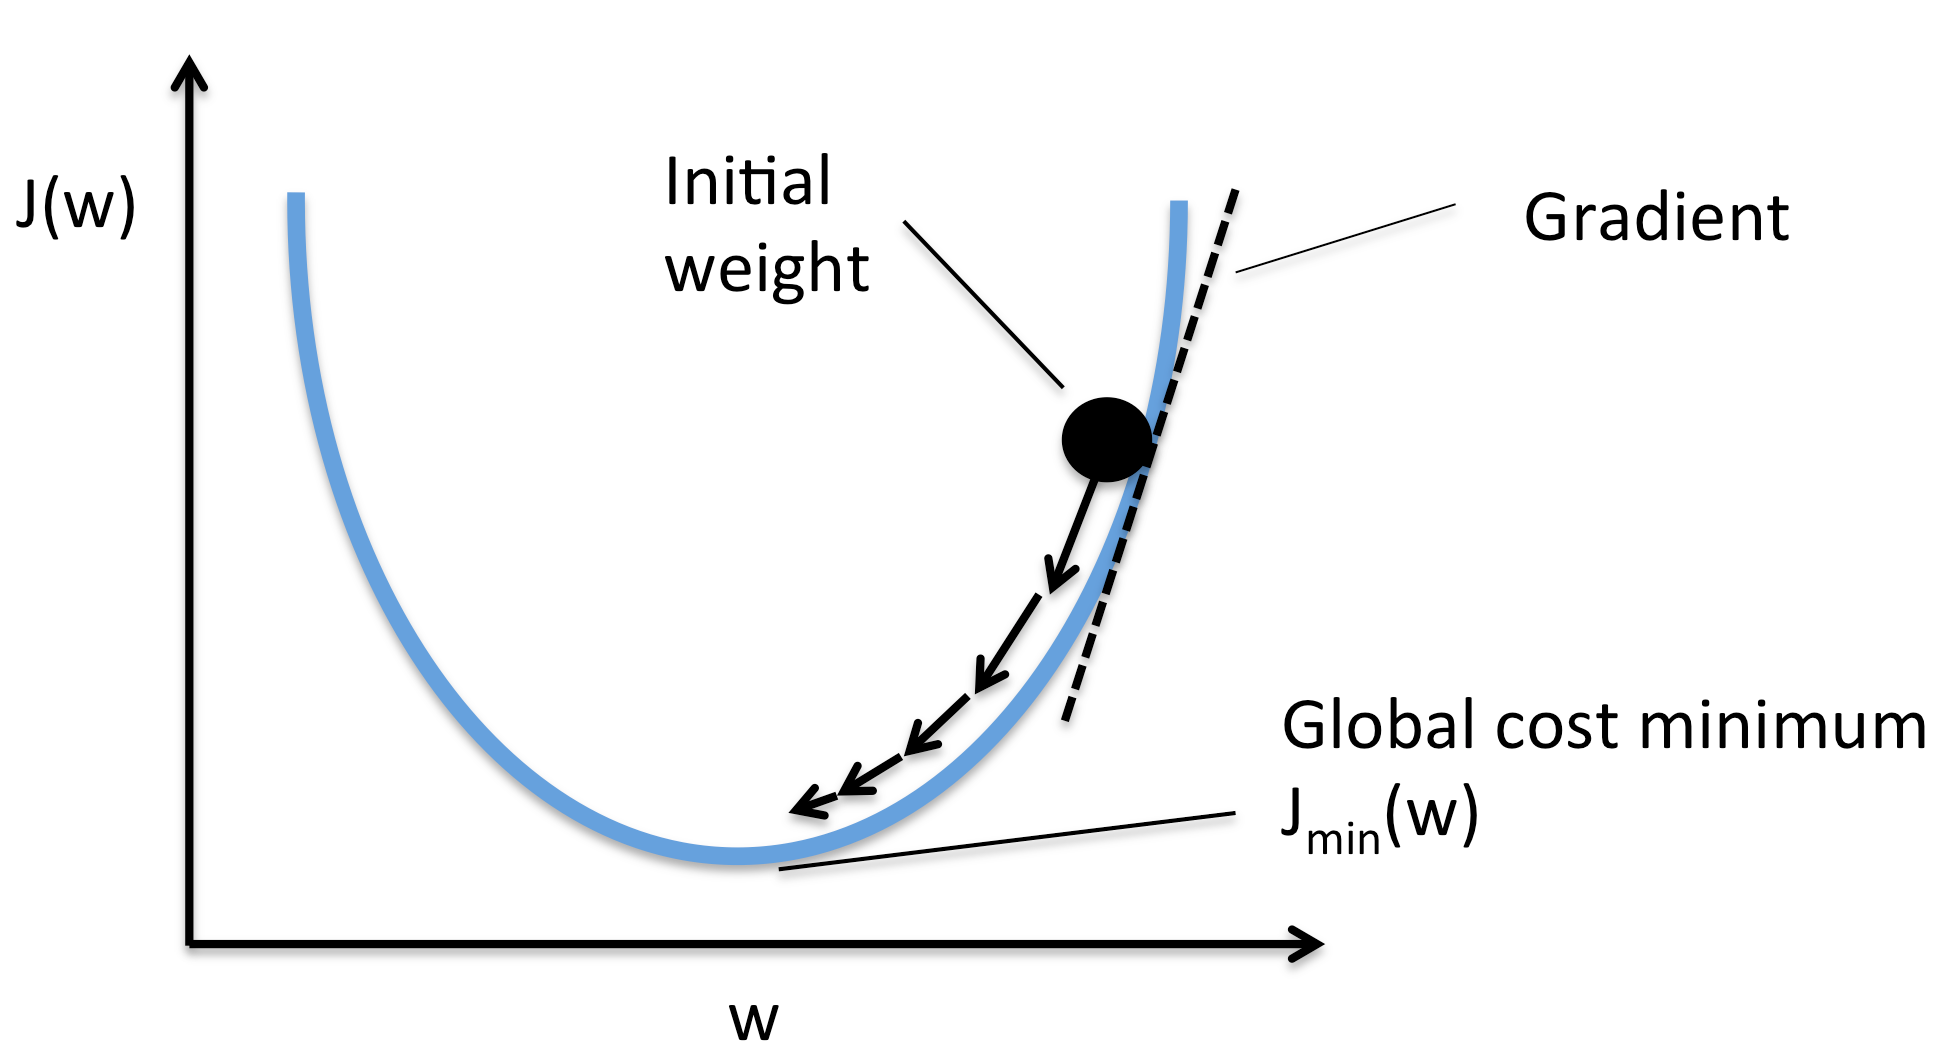
you can visualize the function as valley you have to reach the bottom of the valley so what you will do .? you will try to find where the slope of the valley is going down . Then you start taking the steps towards the down going slope
Once you see that every contour is higher than where you are standing you claim that you have reached the bottom most point
To know the slope of a function at anny point you differentiate that point with respect to its parameters ,thus Gradient Descent differentiates the above Cost Function and comes to know the slope of that point
To go the bottom point it has to go in opposite direction of the slope i.e Where the slope is decreasing .
It has to take small steps to move towards the bottom point and thus learning rate decides the length of step that gradient descent will take
After every move it validates that the current position is global minima or not . This is validated byt he slope of that point ,if the slope is zero then the algorithm has reached the bottom most point
After every step it update the parameter and by doing the above step repeatedly it reaches to the bottom most point
Advamtages:
->Linear Regression performs exceptionally well for linearly separable data.
->Easy to implement and train the model
->It can handle overfitting using dimensionality reduction techniques and cross validation and regularization
Disadvantages:
->Sometimes lot of feature engineering requires
->If independent feature are correlated it may affect performance.
-> It is often quite prone to noise and overfitting
Feature Scaling is required ..! (beacuse minima help us to reach to local minima very quickly)
It is sensitive to the Missing Value
Impact of outlier :
Outliers are the data points which is diferent from other data point that can generally can affect our model .
This problem can be solved by ridge and lasso regressor
MATH INTUITION :

Cost_func=1/2m(sigma(i=1..m)(y^-y) square
Now plotting for different m we can find our gradient Descent then we can stop at local minima at local minima slope =0
Ridge And Lasso Regression:
It tries to reduce overfitting in the Linear Regression Model. It is like Regularization Hyperparameter tuning
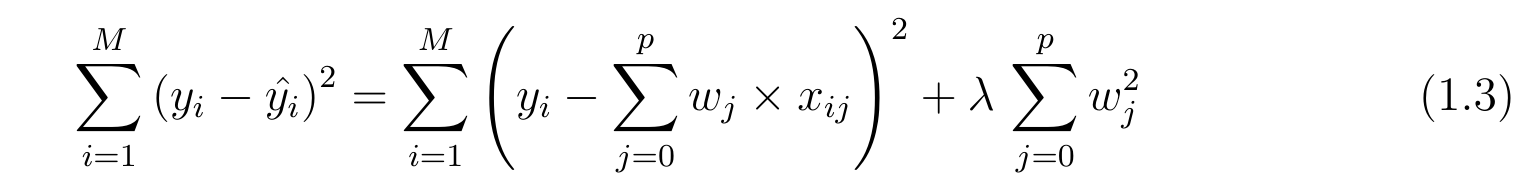
In Ridge Regression the cost function is altered byadding a penalty to square of the magnitude of the coefficients.
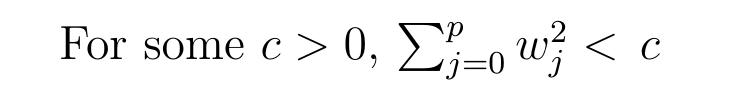
So Ridge Regression puts constraints on the coefficients(w).The penalty term(lambda) regularizes the coefficients such that if the coefficients take large values the optimization function is penalized.
In Linear Regression whenever our residual value(y-y^) is zero means it is best fit line but it is not a generalised model because overfit the data means it cannot determine good results on test data so what we do is we add Regularization parameter (Lasso) which add (lambda)*(slope.square) in our LR cost function so when we have best fit then the cost function of LR is zero but the extra added term will have some value . So Now We have to reduce that value so that it can fit our test set also
So ridge regression shrinks the coefficients and it helps to reduce the model complexity and multi collinearity.
Higher the aplha value , more Restrictions on the coefficients ,low alpha > more generalization, in this case linear and ridge regression resembles
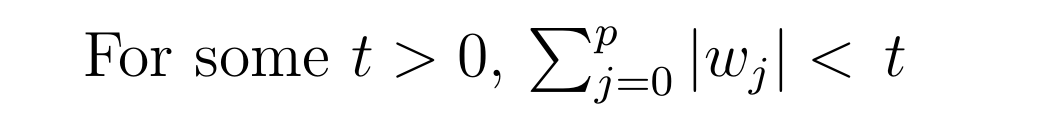
The Cost function of Lasso (least absolute shrinkage and selection operator ) regression can be as:-
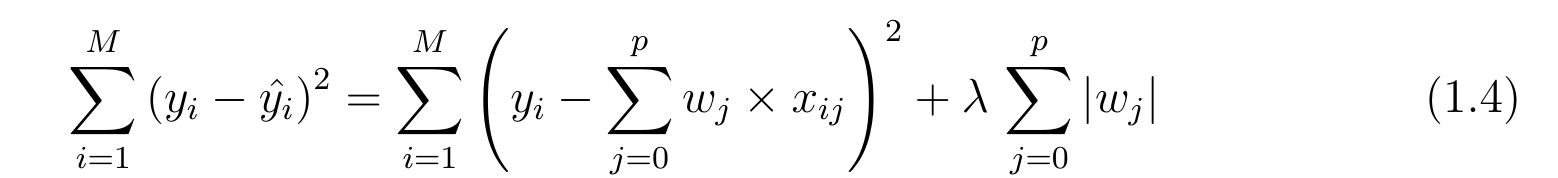
The equation of cost function is same for both Ridge and Lasso regression the only difference is instead of taking the square of the coefficients ,magnitude are taken into account
This type of Regularization (L1) can lead to zero coefficients i.e some of the features are completely neglected for the evaluation of output (Those who have value close to zero)
So Lasso Regression not only helps in reducing overfitting but it can help us in feature selection
Just like ridge regression regularization parameter can be controlled.
Why Lasso Regression result in feature Selection.and Ridge Regression only reduces the coefficients close to zero but not zero?
In this figure we have assume only two features .Using the constrains for the coefficients of Ridge and lasso Regression
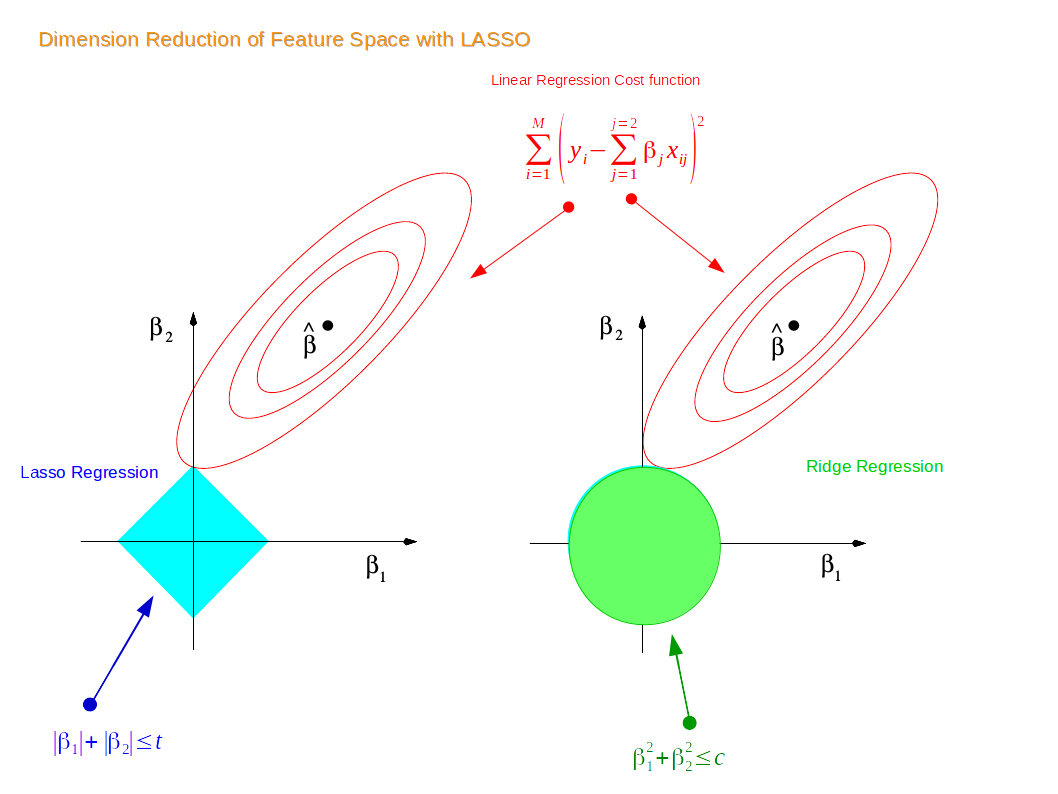
The eppiptical contours are the cost function of linear regression . Now if we have relaxed conditions on the coefficients,then the constrained regions can get bigger nad eventually they will hit the centre of the ellipse . THis is the case wheb the Ridge and lasso Regression resembles linear Regression results.
Otherwise Both methods determine coefficient by finding the first point where elliptical contours hit the region of constraints . The diamond (Lasso) has corners on the axes,unlike the disk and whenever the elliptical region hits such point one of the features completely vanishes
For higher dimensional feature space there can be many solutions on the axis with Lasso Regression and thus we get only the important feature selected


Comments
Post a Comment