Z-Score & Inter Quartile Range
Z stands for Standard Normal Distributions. Its Fairly important in real life . Japan use Z- Score on exam to estimate each student study skills.
Z score used to convert Gaussian Distribution into Standard Normal Distributions
Z-score is essential concept of Z-statistics
Refer to Wiki: Standard score
Refer to Khan academy: Z-score introduction
Refer to youtube: Why Do We Need z Scores
Refer to youtube: Statistics 101: Understanding Z-scores
Refer to Crash Course: Z-Scores and Percentiles: Crash Course Statistics #18
Refer to youtube: z-score Calculations & Percentiles in a Normal Distribution
Z-Score is all about comparison compare different kind of data set . In another word ,Z score indicates How many standard deviations away (aboce or below) from the mean to hte given point
Why do we need Z_scores.?
“Z-scores in general allow us to compare things that are NOT in the same scale, as long as they are NORMALLY distributed.” — CrashCourse
For example, although we know everyone’s score, but by only watching those scores it’s hard to know how good he is or how bad he is compare to anyone else in the dataset. etc., if most of the students score above 90, can we say someone scores 90 is good?
So Z-score gives a solution for this: compare the score to the "average".
Z-score is especially good to compare different type of data, etc., compare 100-score exam & 150-score exam, compare IELTS & TOFEL, compare apples & oranges, compare a baseball player & football player....
All in all, Z-score is a process of Normalization, which "normalize" different set of data to same standard and compare.
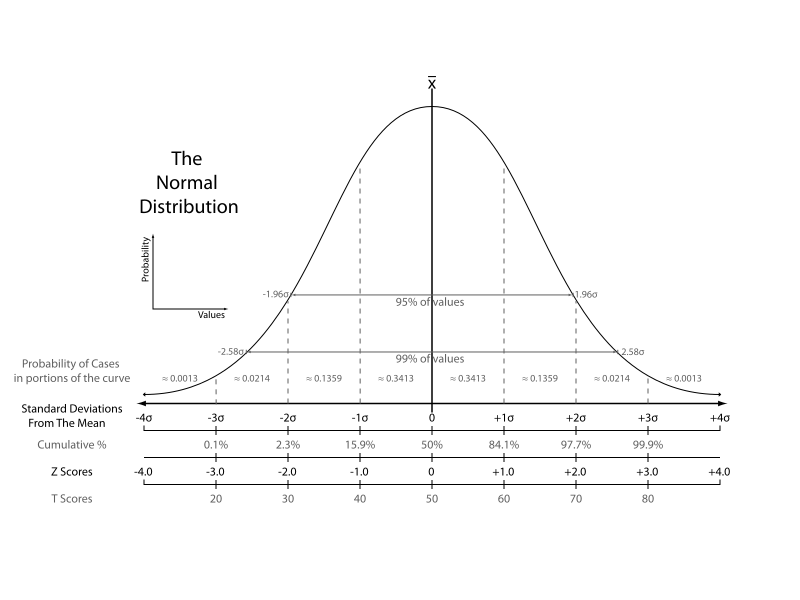
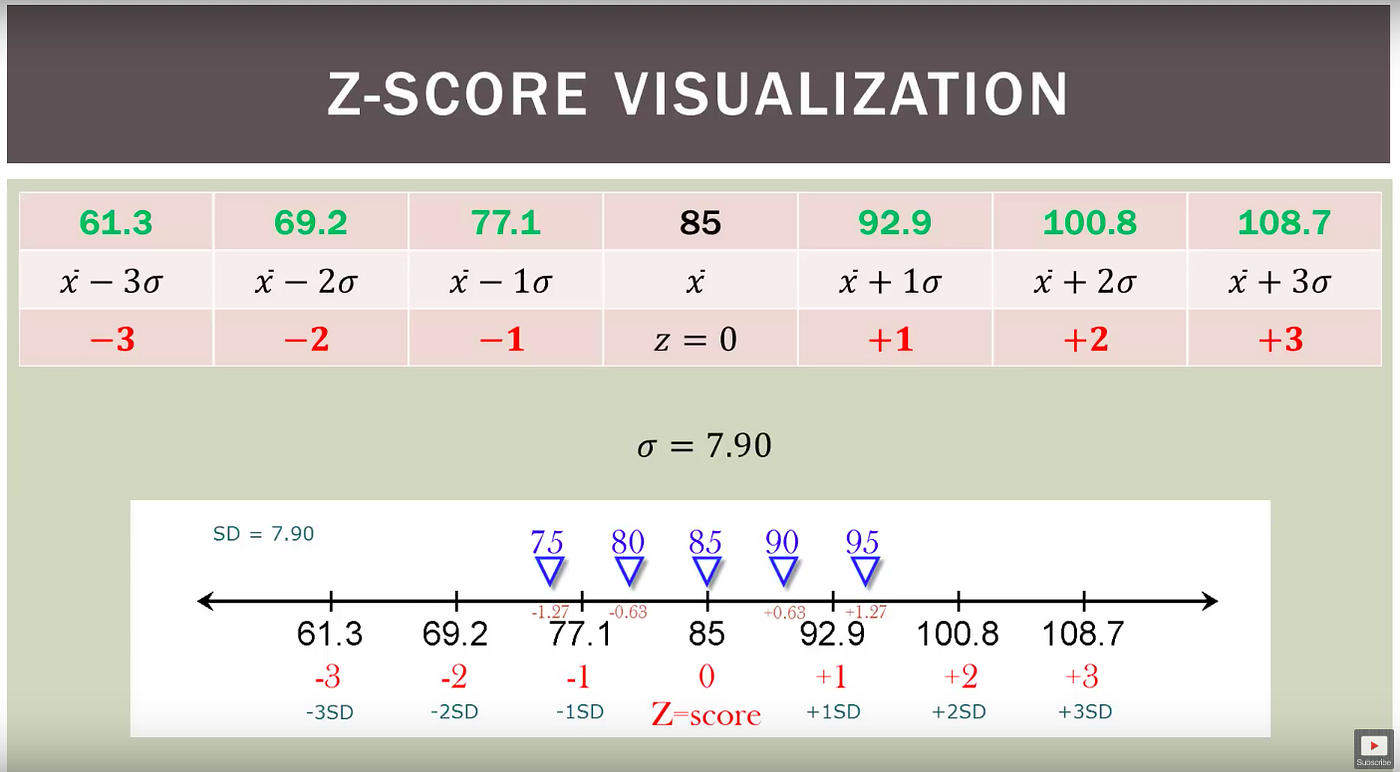
Compares the various grading methods in a normal distribution:
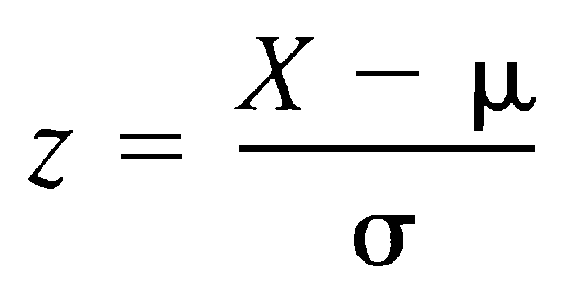
How to understand the formula?

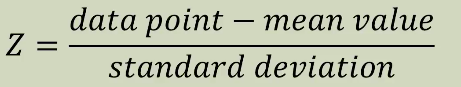
With comparing each one’s score with the mean: x - μ, we will get a kind of deviation.
But at this point we still don’t know whether each one’s deviation is big or small.
We need a "standard" to compare each deviation.
Just like the mean is the average of all scores,standard deviation is the average amount of deviation of all scores, which will tell us each deviation is large or not.
So we want to compare each deviation with the Standard deviation: deviation ÷ 𝜎
And we get the whole picture:Standard Score = (𝓍 - μ) / 𝜎
How to understand the Number of Standard Deviations?
Assume the standard deviation is 𝜎(sigma), so the number of it just means how much it is scaled.
etc., 2𝜎 means a doubled standard deviation, and 1.5𝜎 means 1.5 times larger SD.
If your Z-score is 2𝜎, it means your score is doubled standard deviation away from the mean.
Example
There’s some exam data of a class:
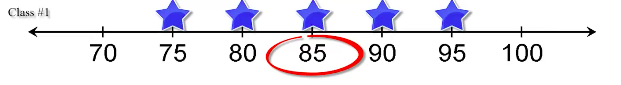
Here’s their z-scores:

Here’s their z-scores:
Example
Solve:
- Isabella’s z-score is:
(20-22)/5 = -0.4 - Hannah’s z-score is:
(33-38)/12.5 = -0.4 - So they’re equally young in their degree level.
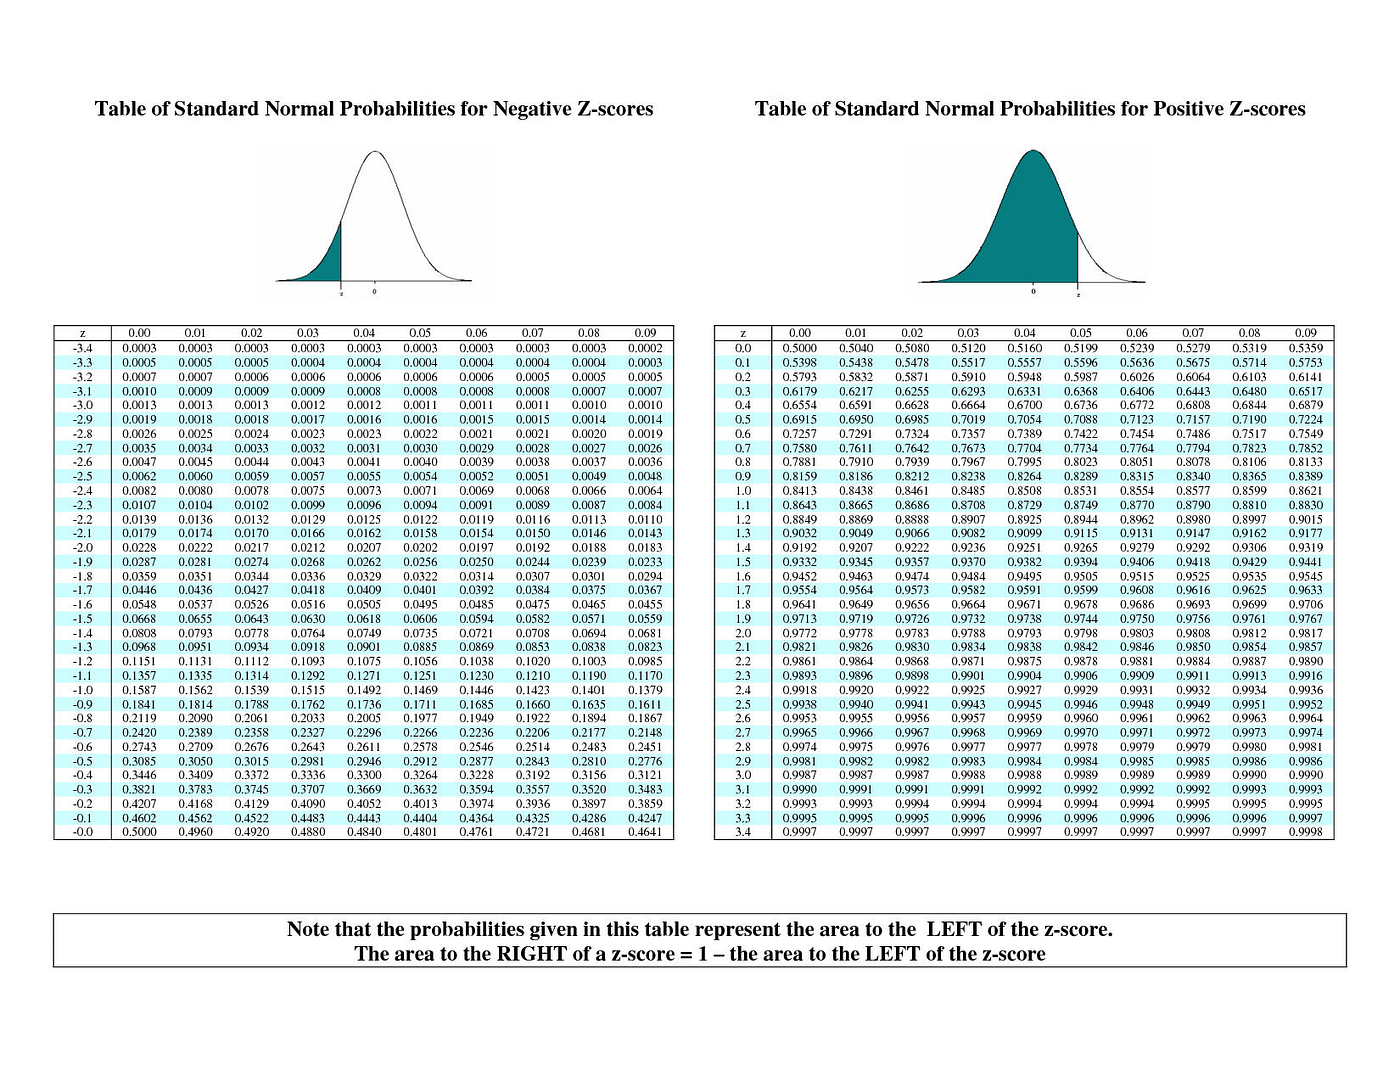
Z-table Convert Z-score to Percentile
This ONLY applies to
Normal Distribution
Refer to Khan academy: Standard normal table for proportion below
If you know someone’s z-score, you will easily get his percentile from the Z-table.
Vice versa, if you know his percentile, you can get his z-score as well.
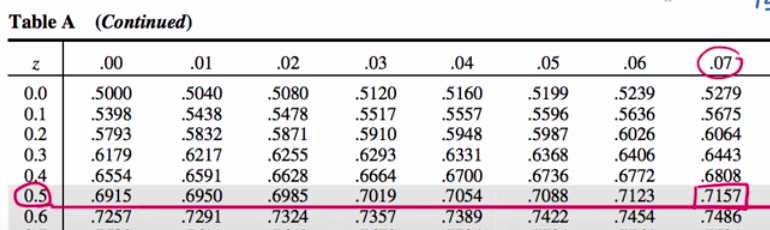
How to use?
The 1st Row represents the tenth decimal of the z-score,
the 1st Column represents the hundredth decimal of the z-score.
According to the given z-score, and search over the rows & columns to get the corresponded intersection, which is the percentile.
etc.,
Someone’s z-sore is "0.57", and you want to know what percentile he's at, or what proportion is below his score.
Just go over to the z-table, first get to the row at 0.5, and find the column of 0.7, and the intersection will be his percentile, which is "0.7157" or "71.57%" in this case.
Common values:
Explicit Z-table:
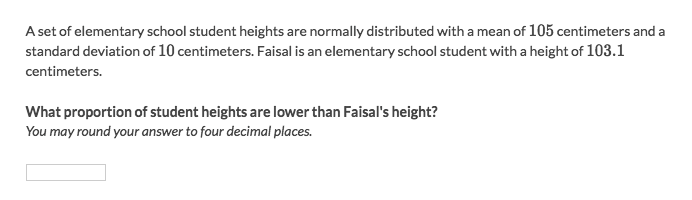
Solve:
- Get the
z-scoreof student Faisal:(103.1-105)/10 = -0.19. - Refer to the
Z-tablewe'll get the correspondingpercentile rank: 0.4247. - The answer is 0.4247 (42.47%) of students are shorter than Faisal.
Example
Solve:
- Get two z-scores:
(82-83.2)/8 = -0.15,(89.2-83.2)/8 = 0.75 - Get both points’ corresponding
percentiles: 0.4404 & 0.7734 - Cut out the “overlays”:
0.7734 - 0.4404 = 0.333 - So the answer is 0.333 or 33.3%.
Z-table Convert Percentile to Z-score
Refer to Khan academy: Finding z-score for a percentile
Just do the other way around by looking for the given percentile cell and then read out the corresponded column & row, that will get you the z-score.
Example
Solve:
- “Top 5%” means the
minimum percentile rankis at 95, which is 0.95 in percentage. - Find out the corresponding
z-scoreaccording to thepercentile: - There’s no “0.95” in z-table but “0.9495” & “0.9505”
- Since the “minimum percentile` is 0.95, so “0.9505” is the one
- “0.9505” corresponds to the z-score “1.65”
- Take the z-score back to
z-score formula:1.65 = (x-66000)/21000 - Get the
x=100650which is the minimum annual profit.


Comments
Post a Comment